B.C. wildfire trends and budget: severity rose, fire-management dollars rose too
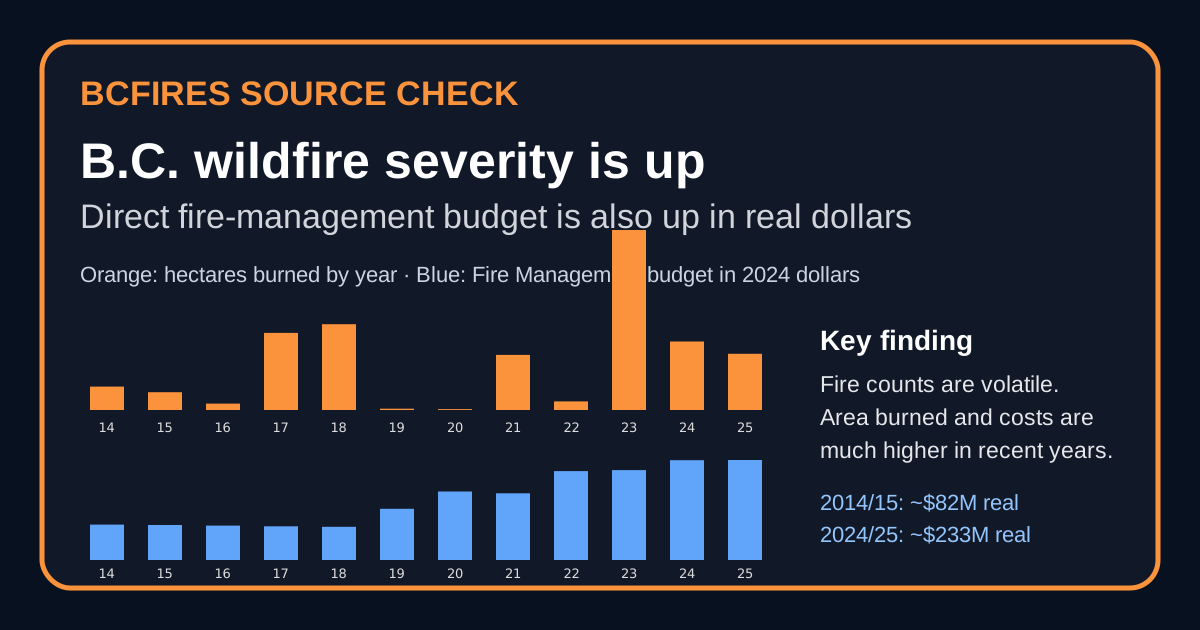
The short version: B.C. has not had a simple straight-line increase in the number of fires, but official data and peer-reviewed research support a major increase in severe area-burned years. The comparable provincial Direct Fire / Fire Management budget line also went up substantially after inflation.
What the user image showed
The supplied image appears to be a selected “Significant Wildfires in the Okanagan” historical table. It is not an official complete BCWS inventory, and OCR shows errors/provisional 2026 entries, so this article treats it as a lead and uses official BCWS/Budget/StatCan data for the answer.
Official wildfire trend table
| Year | Fires | Hectares burned | BCWS estimated cost |
|---|---|---|---|
| 2014 | 1,481 | 369,168 | $297.9M |
| 2015 | 1,858 | 280,605 | $277.0M |
| 2016 | 1,050 | 100,366 | $129.0M |
| 2017 | 1,353 | 1,216,053 | $649.0M |
| 2018 | 2,117 | 1,354,284 | $615.0M |
| 2019 | 825 | 21,138 | $182.5M |
| 2020 | 670 | 14,536 | $193.7M |
| 2021 | 1,647 | 869,300 | $718.8M |
| 2022 | 1,801 | 135,235 | $411.9M |
| 2023 | 2,293 | 2,840,104 | $1094.8M |
| 2024 | 1,697 | 1,081,159 | $769.4M |
| 2025 | 1,370 | 886,300 | not in same table |
BCWS’s 2015–2024 average is 1,531 fires and 791,278 hectares burned per year. Using the 2008–2014 rows from the same official table, the average was roughly 1,772 fires and 157,143 hectares. That means the fire count is volatile, but area burned is much higher in recent severe years.
Peer-reviewed study
A 2023 Communications Earth & Environment paper, “Abrupt, climate-induced increase in wildfires in British Columbia since the mid-2000s,” found that after a century-long decline, B.C. fire activity increased from about 2005 onward, coinciding with warming-driven moisture deficits and fuel/land-use factors.
Real-dollar fire-management budget
The most comparable provincial budget line is older Direct Fire and later Fire Management in B.C. Estimates. It is not every wildfire-related dollar, but it is the consistent voted appropriation line for wildfire-control/preparedness work under the Wildfire Act.
| Fiscal year | Nominal estimate | B.C. CPI | 2024-dollar value |
|---|---|---|---|
| 2014/15 | $63.2M | 118.9 | $82.4M |
| 2015/16 | $63.2M | 120.2 | $81.6M |
| 2016/17 | $63.2M | 122.4 | $80.1M |
| 2017/18 | $63.3M | 125.0 | $78.6M |
| 2018/19 | $64.0M | 128.4 | $77.3M |
| 2019/20 | $101.1M | 131.4 | $119.4M |
| 2020/21 | $136.3M | 132.4 | $159.8M |
| 2021/22 | $136.3M | 136.1 | $155.4M |
| 2022/23 | $194.3M | 145.5 | $207.2M |
| 2023/24 | $204.1M | 151.2 | $209.5M |
| 2024/25 | $232.7M | 155.2 | $232.7M |
| 2025/26 | $238.0M | 158.5 | $233.1M |
From 2014/15 to 2024/25, the line rose from $63.2M nominal to $232.7M nominal. Adjusted to 2024 dollars, that is roughly $82.4M to $232.7M — about a 182% real increase.
Claim table
| Claim | Label | Finding |
|---|---|---|
| B.C. has had a clear increase in number of fires over the last decade. | Not exactly | BCWS annual fire counts are volatile. The 2015–2024 average is 1,531 fires/year, while 2008–2014 averaged about 1,772 fires/year in the official table. |
| B.C. wildfire severity/area burned has increased. | Supported | BCWS data show recent record/severe area-burned years: 2023, 2018, 2017, 2024, 2025 and 2021 are all near the top of the 2008–2025 table. |
| Peer-reviewed research supports a shift toward more severe B.C. wildfire years. | Supported | Parisien et al. 2023 in Communications Earth & Environment reports that after a century-long decline, B.C. fire activity increased from 2005 onward, with climate-induced moisture deficits and fuel/land-use factors. |
| The direct fire/wildfire management budget went down after inflation. | Not supported by the comparable Estimates line | The Direct Fire / Fire Management estimate rose from about $63.2M in 2014/15 to $232.7M in 2024/25. In 2024 dollars, that is roughly $82.4M to $232.7M, an increase of about 182%. |
| Higher real spending proves B.C. is spending enough on forest-risk reduction. | Not proven | The comparable fire-management line rose, but adequacy is a different question because drought, WUI exposure, fuel loads, staffing, prevention, FireSmart and suppression-cost overruns are separate issues. |
| The user-supplied Okanagan table is a complete official wildfire inventory. | Not supported | The image describes a selected significant-fire summary, not a complete BCWS inventory, and OCR shows errors and provisional 2026 entries. |
Bottom line
B.C. has had several extreme wildfire seasons in the recent decade, especially by hectares burned and cost. The budget line for direct fire/fire management has also increased in real terms. The remaining public-policy question is not “did the line go down?” — it did not — but whether the money, staffing, fuel treatment, FireSmart work and land-management changes are enough for the risk B.C. now faces.